Claude Gets Native OpenTelemetry Support in Databricks MLflow
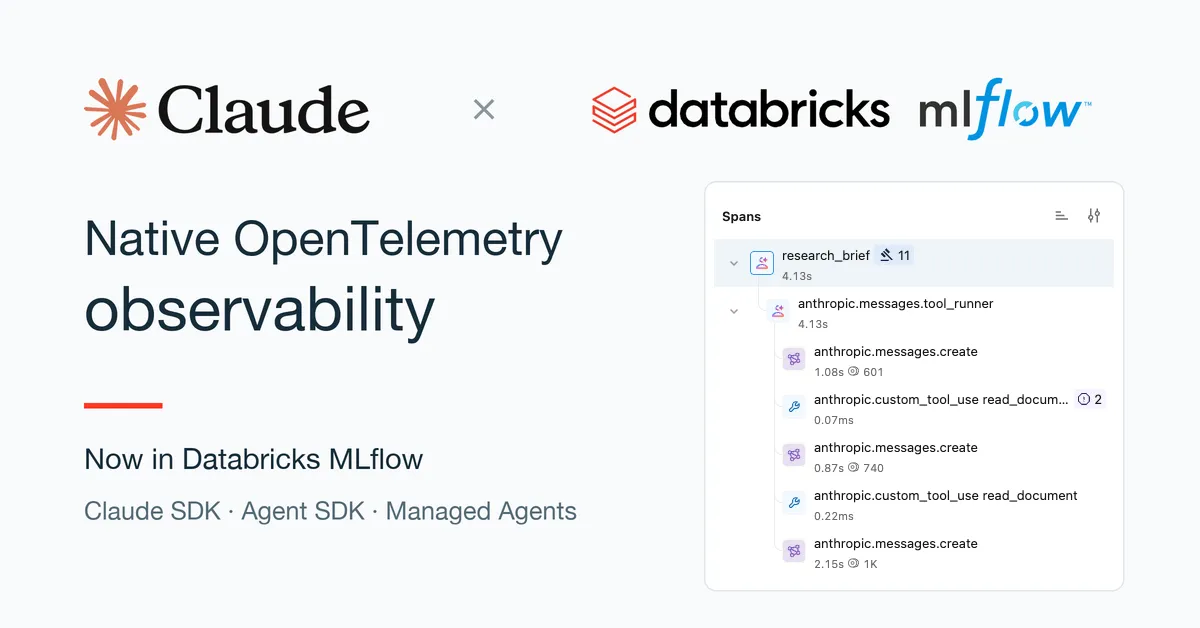
Claude Platform's native OpenTelemetry export is now available in public beta for Databricks MLflow. Developers can track and investigate runs from the Anthropic SDKs, the Messages API and Claude Managed Agents, and measure changes against the same test cases.
- Claude Platform's native OpenTelemetry export is now available in public beta.
- Traces are stored in Databricks MLflow Unity Catalog tables.
- The Anthropic SDKs, the Messages API and Managed Agents are supported.
- MLflow supports development with analysis, expert review and evaluation.
Claude runs flow into MLflow
Databricks said Claude Platform can now be connected to Databricks MLflow as a supported destination through native OpenTelemetry export. OpenTelemetry is an open standard for measuring how services operate and exporting their data.
Tracing breaks an agent run into separate steps known as spans. These can include model requests and tool calls. Claude's native instrumentation creates the spans and sends them through the OpenTelemetry Protocol.
Databricks receives the data using Zerobus Ingest and stores it in Unity Catalog tables linked to an MLflow experiment. Developers can inspect Claude traces alongside traces from other instrumented services. Access is managed by Unity Catalog, and the data can also be queried with SQL.
Setup takes three steps
According to Databricks' guide, users must first create an experiment in the Experiments view. Unity Catalog remains selected as the storage location for traces, after which users choose the catalog and schema they want to use. This creates the link between the MLflow experiment and the Unity Catalog table that stores the traces.
The developer can then configure the Databricks destination with the workspace ID, region and spans table. A table-level OAuth token is required for the Zerobus connection. The native integrations cover the Anthropic SDKs, the Messages API and the Managed Agents system. Claude Code and the Claude Agent SDK also support OpenTelemetry.
After a run, the Traces view shows model calls, tool activity, timing, and captured inputs and outputs. The latter are included only if the developer sets the content mode to “full.”
Debugging, expert review and evaluation
MLflow's Analyze trace feature uses Databricks Genie Code to examine a selected Claude run. The system can help uncover missing context, failed tool calls or unnecessarily costly steps, for example. Developers can ask additional questions about the cause of a problem.
The beta MLflow Issues feature looks for recurring quality and operational problems across traces and sessions. It examines responses, tool calls, timing, errors and evaluations, then groups them into related findings. Databricks cites unnecessary repeated searches, missing arguments that cause tool errors and responses that fail to follow the required format as examples.
Teams can also involve domain experts through MLflow Review Queues. Experts can assess assigned traces, flag shortcomings and provide the expected response. MLflow Agent Evaluation can compare older and modified versions of an agent on the same test cases, such as checking whether a tool call was repeated.
What does this mean for developers?
Based on the announcement, developers of Claude agents can follow run details in a single workflow, look for recurring problems, gather expert feedback and measure the impact of changes. Traces also show the model and tool steps behind an incorrect response, allowing evaluation to cover execution as well as the final result. The public beta enables the Anthropic SDKs, the Messages API and Claude Managed Agents to connect to Databricks MLflow.